Debugging the Hollowing Process
The first API call you will see will be to CreateProcess. More often than not the Command Line parameter will be the same as that used to create the initial process. The Creation Flag will be set to CREATE_SUSPENDED as shown here. The return value from this call will be a handle to the process, which will be passed as a parameter to the calls detailed below.

Once the process has been created the next relevant API call will be to NtUnmapViewOfSection, in order to hollow out the code from the newly created process. This will be followed by a call to VirtualAllocEx in order to create a writable area of memory within the new process. Several important parameters include the Address and Protection Flags for the new memory section.

The next call will be to WriteProcessMemory. This will allow you to see where within the parent process’s memory the code is being copied from, which may be useful when reversing droppers and packed malware. There may be more than one call to this API function as the code may be split into several different areas of memory within the parent process. In the example I debugged whilst writing this tutorial the code looped over the various PE sections writing them each separately into the new process.
Once the code has been written it is necessary to instruct the process where to find the new entry point. This is accomplished using the GetThreadContext and SetThreadContext API Calls. First a call will be made to GetThreadContext in order to read the information into a buffer which may be edited. Changes are made and then written back to the new process with SetThreadContext. As seen here one of the parameters of SetThreadContext is a pointer to the buffer containing the new Context structure.

By right clicking the value next to the pContext parameter, selecting “Decode as Pointer to Structure” and then selecting CONTEXT from the list of available structures it is possible to view the data being written to the new process. Look for the value of the EAX register within the decoded structure to find the new entry point. In this example the entry point will be 0x45E8C0.

The last API call will be to ResumeThread. Once this call is made the new process will resume running from the entry point defined in the context structure previously mentioned. In order to be able to follow this new process from the start it will be necessary to patch it before allowing the call to ResumeThread.
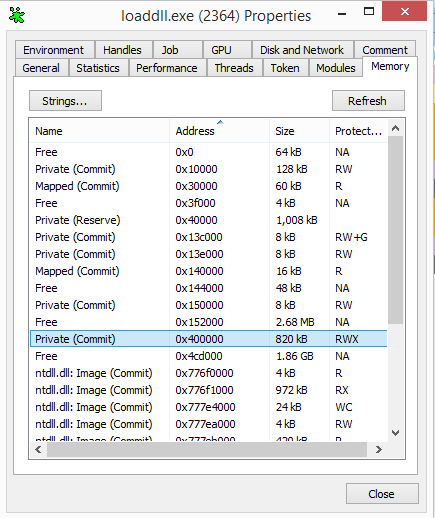
To do this you can use the Process Hacker tool available from http://processhacker.sourceforge.net/. This is my task manager of choice when monitoring malware activity. Processes are displayed as a tree so it is easy to discern the one you are interested in. Also it will be greyed out as it is currently in a suspended state. Gring up the properties dialog from the right click menu or by simply double clicking the process. Selecting the memory tab will display a full map of the virtual memory. In most cases the area of memory you are interested in will be at 0x400000, however if it is not there it can be located by looking for the section which is marked as executable in the Protect column and whose name shows as “Private (Commit)”.

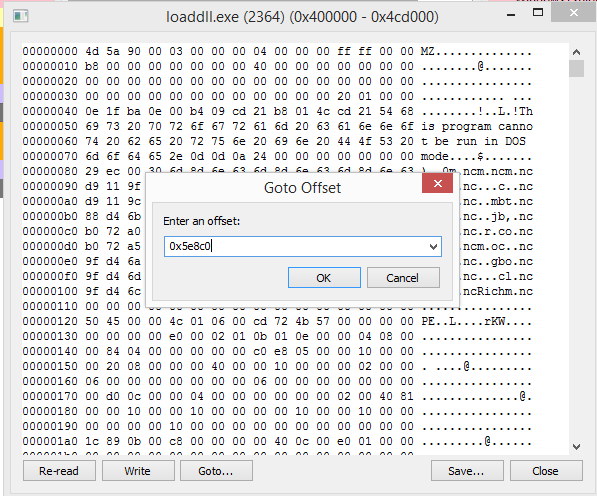
Double clicking the entry in the dialog will open the memory section in a hex editor. Use the Goto… button at the bottom of the dialog and enter the hexidecimal address. This needs to be as an offset so in the example the Entry Point is 0x45E8C0 and the offset will be 0x5E8C0. You must enter the 0x prefix or the Goto function will fail.

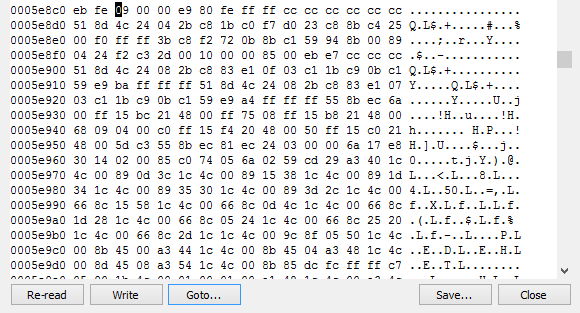
Once you have found the Entry Point within the hex it needs to be patched in order to allow the use of the debugger. One option is to replace the first byte with CC, which is the same as setting an INT 3 software breakpoint. This will only work if you have OllyDbg set up as the Just-In-Time debugger. My preferred option is to replace the first two bytes with EB FE. This will cause the process to enter an infinite loop when it is resumed. Which ever option you choose make sure that you record the original values so that you can change them back later. Here I have patched the values to cause looping. Click the Write button to commit your changes to memory.

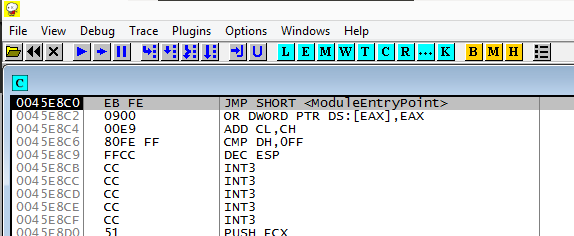
Once the patch is in place continuing stepping through the original process until you reach the ResumeProcess API call and allow this to execute. The process will now start to execute from your patched code. If you have chosen the breakpoint option the process should open automatically in your Just-In-Time debugger. If, like me, you prefer to use the infinite loop option then you will need to manually attach OllyDbg to the new process. As you can see here the debugger attaches successfully paused at the patched code section.

The final step is to replace the patched code with the original values. Right click the address of the first instruction in the assembly view and select Follow in Dump. This will cause the hex view beneath to sync with the assembly view. Select the patched values like so.

Over type the selected hex with the original values you noted earlier.

This will cause the code above to change as shown here.

Once this has been accomplished it is possible to go on and debug the new process as normal. If working in a VM it is wise to take a snapshot at this point as restarting the process using the “rewind” button in OllyDbg will cause it to load the original image from disk, rather than the code written into it by the hollowing process, instead it is better to revert your VM.


